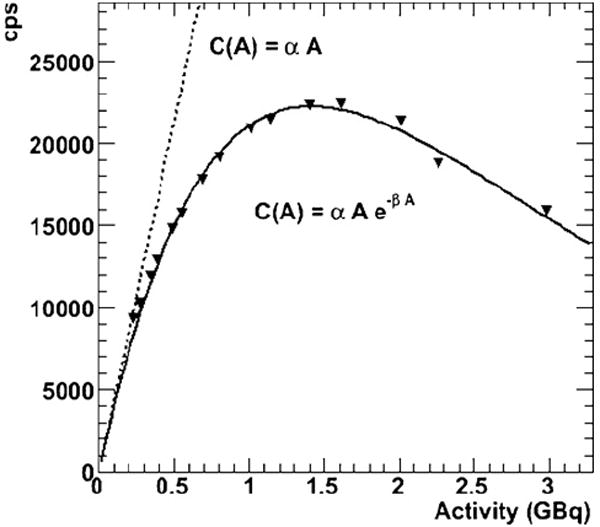
Figure 4.

Phantom saturation curve. The phantom consists of 1.0 cm of plexiglass covering 1.2 cm of solution, so the appropriate attenuation modifiers were applied. The triangles are the measured counts per second (cps) values as a function of the decaying activity. The solid line shows the fit using equation (1) and the dotted line shows the theoretically unsaturated linear response. The determined α and β values are the same as used in figure 2, but the range of activities extends further out here.
