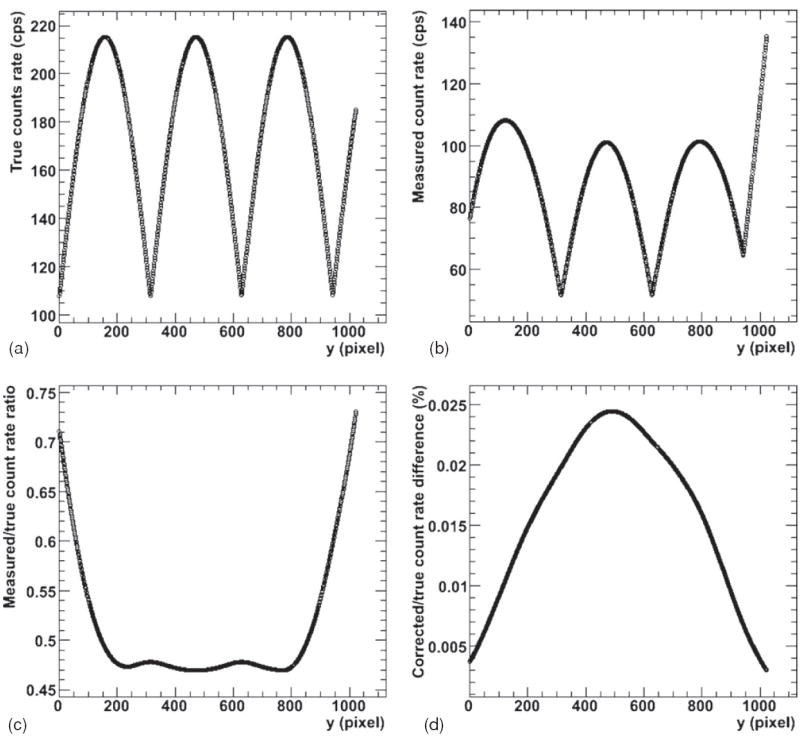
Figure 5.

Iterative saturation correction results for the simulated (computer-generated) data. (a) The original ‘true’ data; (b) the simulated ‘measured’ data. (c) The ratio of ‘measured’ to ‘true’ data. The corrected data are compared with the original ‘true’ data as percent difference in (d).
