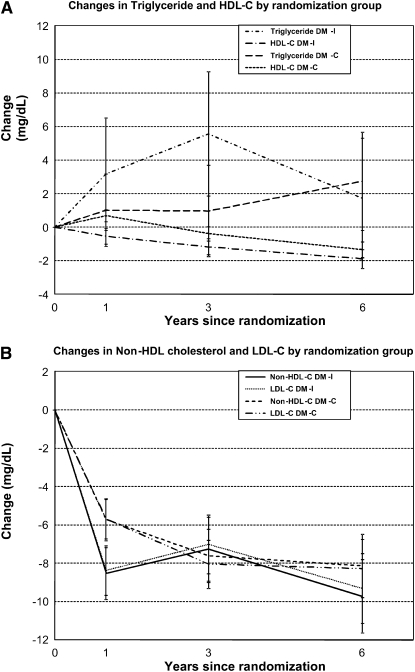
FIGURE 2.
Six-year mean (±SE) changes in triglyceride and HDL-cholesterol (HDL-C) concentrations (A) and in non-HDL-cholesterol (Non-HDL-C) and LDL-cholesterol (LDL-C) concentrations (B) by randomization group. Significant differences in changes in HDL cholesterol at year 1 (P < 0.01) and in LDL cholesterol at year 3 (P < 0.05) were observed between women in the intervention and comparison groups of the Women's Health Initiative Dietary Modification Trial (DM-I and DM-C, respectively).

