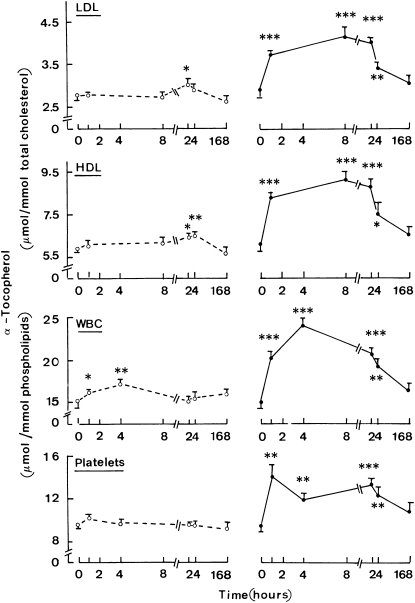
FIGURE 4.
Mean (±SEM) α-tocopherol content of lipoproteins and circulating cells. Time course for the changes in the α-tocopherol content of LDL and HDL (μmol/mmol total cholesterol) and the white blood cell (WBC) and platelet phospholipids (μmol/mmol phospholipids) after injection of either the medium-chain triacylglycerol:long-chain triacylglycerol emulsion (left) or medium-chain triacylglycerol:fish oil emulsion (right). The time zero values refer to the absolute measurements of each variable made before the injection of the lipid emulsion. The later values refer to the increment of each variable above the paired basal measurement and are shown together with the significance of such paired changes (*P < 0.05, **P < 0.005, ***P < 0.001). Values refer to 12 individual determinations. Note the difference in scale of the abscissa in the left and right parts of the figure.

