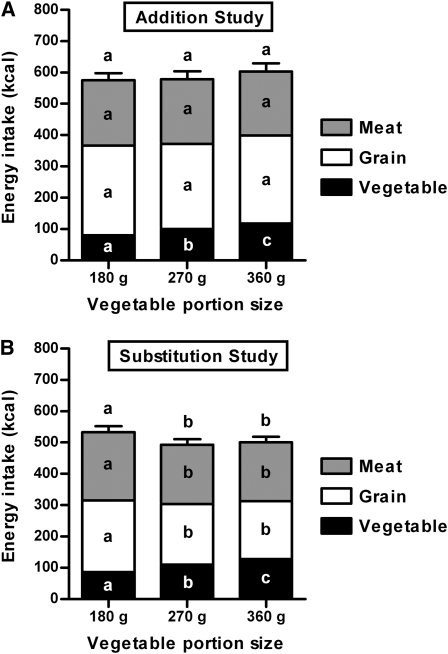
FIGURE 2.
Mean (±SE) energy intake according to the portion size of the vegetable served in the addition study (A; n = 49), in which the extra vegetable was added to other meal components, and the substitution study (B; n = 48), in which the extra vegetable was substituted for other meal components. The effects of vegetable portion size were independent of the effects of vegetable energy density in both studies; thus, the values are shown for both energy densities combined. Within each meal component, values with different letters are significantly different (P < 0.0007) as assessed by a mixed linear model with repeated measures.

