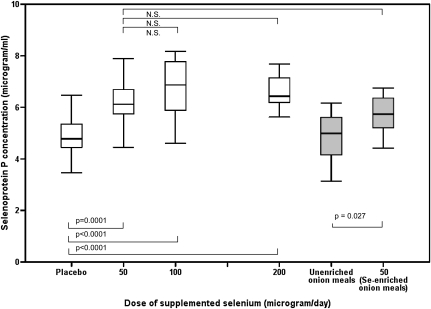
FIGURE 4.
Dose response of plasma selenoprotein P concentrations over a range of selenium-enriched yeast supplement doses and comparison with the food intervention groups. Data shown are from week 10 data when selenium status had reached steady state. The box plots show the median and interquartile range for the placebo (n = 20), 50 μg Se-yeast/d (n = 18), 100 μg Se-yeast/d (n = 21), 200 μg Se-yeast/d (n = 23), 0 μg Se/d unenriched onion meal (n = 17), and 50 μg Se-enriched onion meal/d (n = 18) groups. The significant changes over the dose range are shown, including the comparison between the two 50-μg/d groups (selenium-yeast compared with selenium-enriched onions). Data were analyzed by using a single mixed-effects model, and Tukey's honestly significant difference test was used to assess pairwise differences between groups. There was a significant effect of time (P < 0.001), treatment (P < 0.001), and time × treatment interaction (P < 0.001) on plasma selenoprotein P concentrations. The box plots displaying the food intervention group data are shaded gray to distinguish them from the supplement and food groups.

