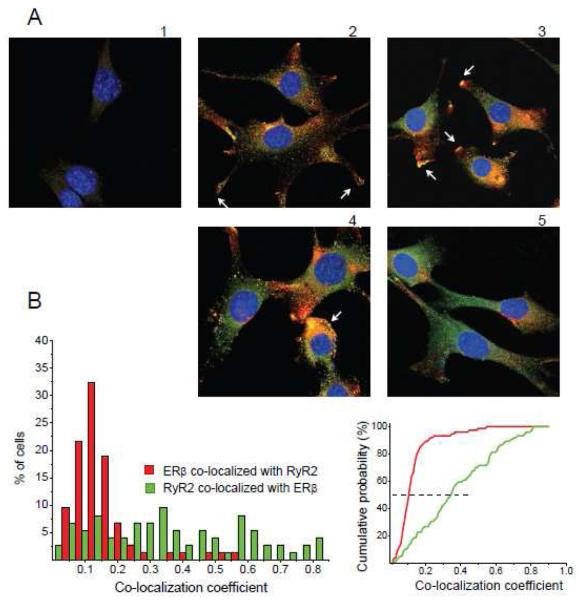
FIGURE 2. The RyR2 and ERβ co-expression pattern is highly variable in HT-22 cells.
A, In HT-22 cells with cell-cell contacts, ERβ perimembrane localization could be found in tips of growing processes (2), high level of RyR2/ERβ co-localization was characteristic for growing edges (3) and large cytoplasmic areas (4), while also areas with no substantial co-localization could be observed (5). B, (left) Histograms collected from 74 HT-22 cells, reflecting a percentage of co-localized immunoreactivities relative to the total amount for each of two receptors, observed in separate cells. (right) Cumulative histograms of co-localization coefficients (CC) yielded medians at 0.105 for ERβ and 0.347 for RyR2. The control, low intensity non-specific secondary antibody binding, which was cutoff at 25% through a high-pass numerical filtering during CC calculations (see Methods), is illustrated in panel A,1.

