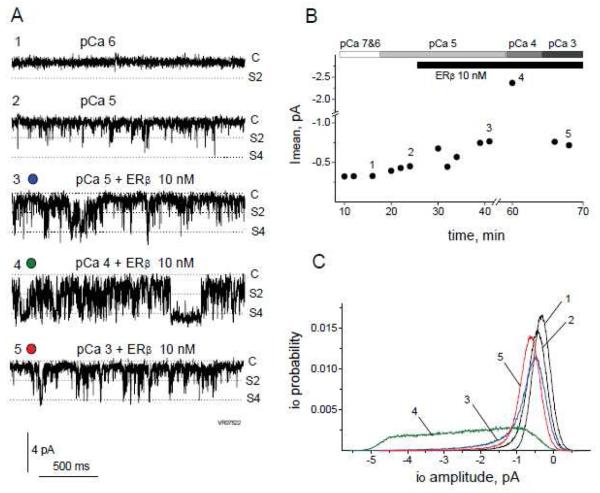
FIGURE 9. Maintenance of RyR Ca2+ dependence in the presence of ERβ.
A, Representative 2 s long traces of a continuous single channel current recording from the same RyR obtained at pCa 6 (1), pCa 5 before (2) and after (3) 10 nM ERβ application and at pCa 4 (4) and pCa 3 (5) in the presence of 10 nM ERβ. Closed state (C), io=2pA (S2) and io=4pA (S4) substates are marked to the right of each trace. B, Time-course presentation of the mean current (Imean) values calculated from 60 s continuous recordings. Bars on top indicate the time course of [Ca2+]cis changes and ERβ application. Notable is a sharp decrease in Imean values at pCa 3 due to the RyR inactivation after a strong previous increase in Imean at pCa 4 in the presence of 10 nM ERβ. Numbers on the graph correspond to the time intervals for representative traces in part A. C, P(io) histograms calculated from 60 s continuous current recording traces (corresponding to numbered intervals from part B). A broad range of io sublevels appearing at pCa4 (line 4) decreases at pCa3 (line 5) due to the RyR inactivation.

