


Figure 2.
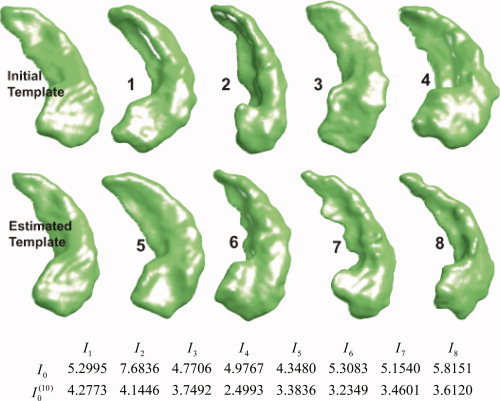
Initial template and the generated BIRN template after iterations of the template estimation algorithm through the collection of shapes (left column); 8 of the 101 shapes are shown. The first row of the table shows the metric distances  between the original template I
0 and the population; second row shows the distance of the constructed template I
.
between the original template I
0 and the population; second row shows the distance of the constructed template I
.