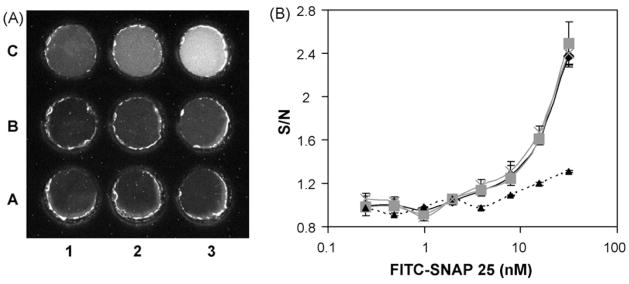
Fig. 2.
The optimization of the 9-well chip base material using FITC-SNAP-25 peptide. (A) CCD image of FITC-SNAP-25 dose response solutions added to the 9-well black chip taken using the EL-CCD detector, 120 s exposure. The COC based wells were loaded with FITC-SNAP-25 at concentrations ranging from 0 nM (A1) to 31.25 nM (C3). (B) The dose response curves plotted versus signal-over-noise (therefore blank = 1) for the different chip base materials; COC (black diamonds/solid line), PC (gray squares/solid line), Mylar (black triangles/dashed line) and glass (gray crosses/dashed line). Standard deviations were determined from n ≥ 3 chips.

