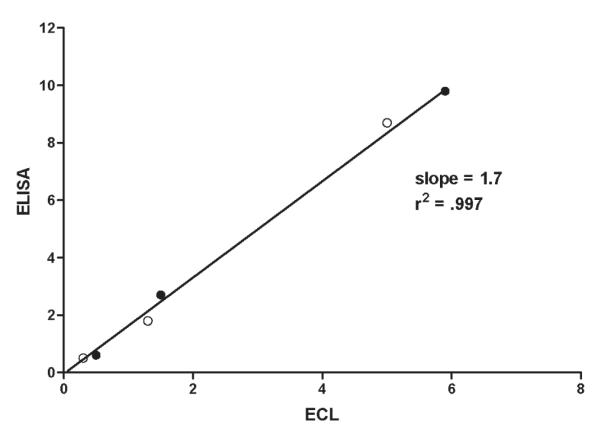
Figure 4.

Correlation between ECL assay results and the ELISA assay results using the method of Naar et al. (ref. 4) on a common sample set. Open circles represent samples extracted with acetone and closed circles represent samples extracted with 80% methanol. See the text for method details.
