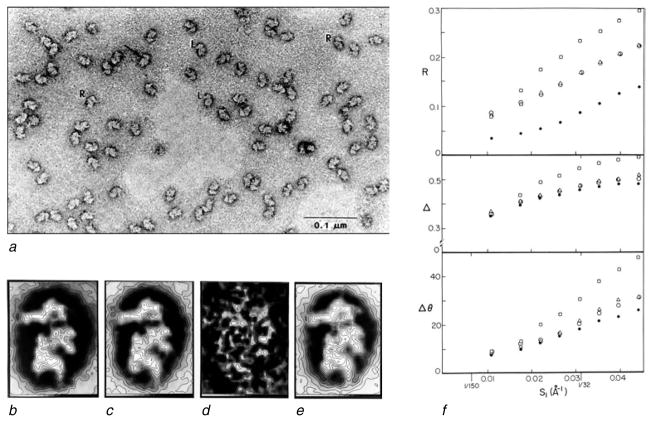
Fig. 2.
Averaging of 40S subunits from HeLa cell ribosomes. (a) Electron micrograph of negatively stained subunits, with “L” denoting left-facing views selected for alignment and averaging. (b, c) Averages of halfsets of 40 particles each; (d) variance map; (e) total average; (f) three measures of resolution: R, R factor; Δ, Euclidean distance; δϕ, DPR indicating a resolution of 20 Å at 45°. Data reproduced from Frank et al. (1981b); panels R and Δ in (f) are from unpublished data.

