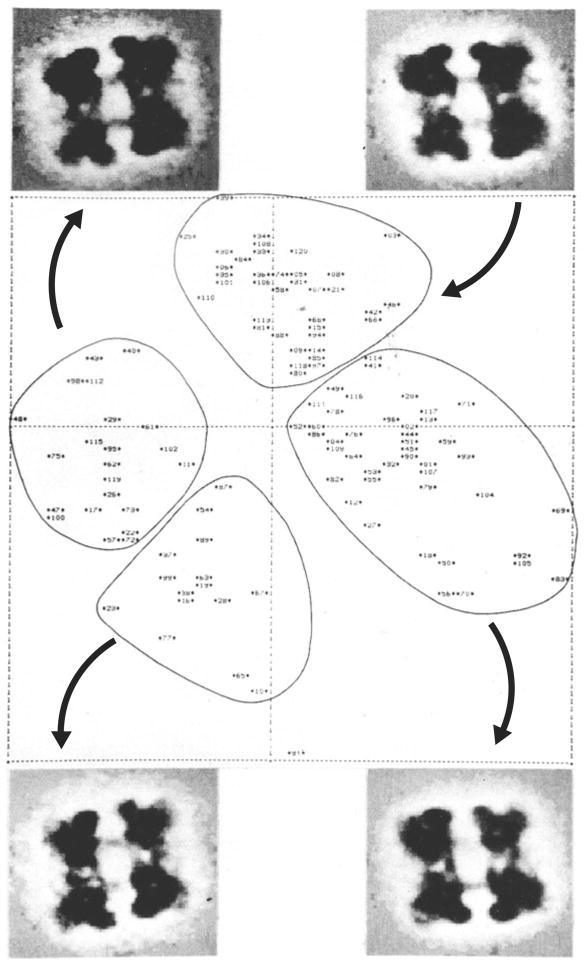
Fig. 4.
Factor map (factors 1 versus 2) resulting from correspondence analysis of L. polyphemus hemocyanin half molecules. Averages of images falling into demarcated clusters are shown in the four corners (a–d). (a) and (c) are interpreted as two rocking positions of molecules lying on one (“flip”) side, while (b) and (d) relate to rocking positions on the other (“flop”) side. Adapted from Frank (1984).

