FIG. 1.
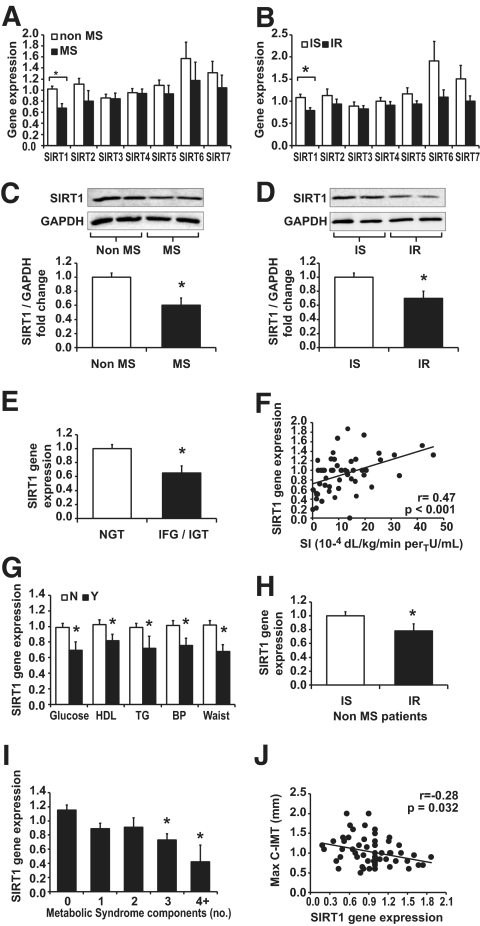
SIRT1-SIRT7 gene and protein expression in PBMCs. Subjects were first divided by the presence/absence of metabolic syndrome and by insulin-resistant or insulin-sensitive status. A: Q-PCR analysis of SIRT1-SIRT7 gene expression in PBMCs from metabolic syndrome and from non–metabolic syndrome subjects. B: Q-PCR analysis of SIRT1-SIRT7 gene expression in PBMCs from insulin-resistant and from insulin-sensitive subjects. The relative quantification was achieved by the expression of each gene of interest by housekeeping genes according to ΔΔCt formula. C and D: Western blot analysis of SIRT1 from PBMCs of two representative patients with and without metabolic syndrome or insulin resistance. Densitometric analysis of SIRT1 after normalization for glyceraldehyde-3-phosphate dehydrogenase in the whole cohort of subjects is described in the results section. E: Subjects were also divided according to OGTT results into subjects with NGT and pre-diabetic subjects (either IFG or IGT): SIRT1 expression in subjects with NGT was significantly reduced compared with pre-diabetic subjects (*P < 0.05). Protein expression data are described in the results section. F: SIRT1 gene expression was significantly directly correlated with Si. G: Subjects were also divided according to the presence (black columns) or absence (white columns) of each metabolic syndrome component, as defined by revised ATP-III criteria (*P < 0.05). I: When subjects were divided according to the number of metabolic syndrome components, SIRT1 expression was progressively downregulated by increasing number of components (*P < 0.05 vs. 0 components after α-correction; ANOVA, P < 0.05). H: Subjects divided according to metabolic syndrome and insulin sensitivity: in nine subjects without metabolic syndrome classified as insulin resistant, there was a significant SIRT1 downregulation compared with insulin-sensitive subjects. *P < 0.05. J: Negative significant correlation between SIRT1 gene expression and maximal carotid IMT. Data are expressed as mean ± SE.

