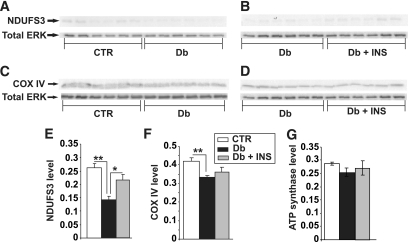
FIG. 6.
Expression of components of the electron transport chain are reduced in DRG from STZ-diabetic rats. Shown are representative blots (A–D) and charts in which NDUFS3 (E), COX IV (F), and ATP synthase β subunit signal (G) have been presented relative to total ERK level. Values are the means ± SEM, n = 6. **P < 0.005 vs. control (CTR), *P < 0.05 vs. Db + INS (one-way ANOVA with Tukey's post hoc test). Db, diabetic; Db + INS, diabetic with insulin implant.

