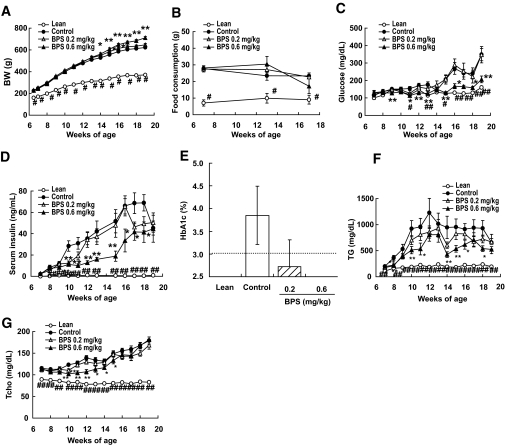
FIG. 1.
Body weight (BW) (A), food consumption (B), serum glucose (C), insulin (D), A1C (E), TG (F), and total cholesterol (G) in control obese Zucker rats (●), obese Zucker rats treated with BPS (▵, 0.2 mg · kg−1 · day−1; ▴, 0.6), and Zucker lean rats (○) as line graph, and control obese Zucker rats (□), Zucker rats treated with BPS (▨, 0.2 mg · kg−1 · day−1; ■, 0.6), and Zucker lean rats ( ) as bar graph. Data are mean ± SE of 7–8 rats. *P < 0.05, **P < 0.01 versus control rats by parametric Williams test (body weight, food consumption) and nonparametric Williams test (glucose, insulin, TG, and total cholesterol). #P < 0.05, ##P < 0.01 versus control by t test (body weight, food consumption) and Welch test (glucose, insulin, TG, and total cholesterol).

