FIG. 3.
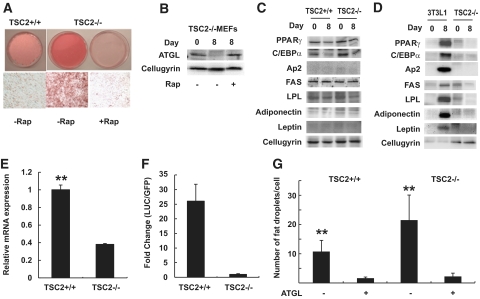
Genetic ablation of TSC2 promotes accumulation of triglycerides and decreases expression of ATGL in MEFs. A: Wild-type (TSC2+/+) and TSC2−/− MEFs were cultured in DMEM with 10% FBS for 8 days after confluence with (+Rap) or without (−Rap) 100 nmol/l rapamycin. Cells were then fixed in formaldehyde and stained with oil red O. Representative photographs of the plates (top panels) and respective micrographs (bottom panels) are shown. B: Western blot analysis of the ATGL protein in total cell lysates (50 μg) prepared from TSC2−/− MEFs immediately after confluence (day 0) or after 8 days of confluence (day 8) with or without 100 nmol/l rapamycin (Rap). Cellugyrin was used as loading control. C: Whole-cell lysates were prepared from TSC2+/+ and TSC2−/− MEFs immediately after confluence (day 0) or after 8 days of confluence (day 8) and analyzed by Western blotting. D: Total lysates obtained from TSC2−/− MEFs immediately after confluence (day 0) or after 8 days of confluence (day 8) were analyzed by Western blotting. 3T3-L1 preadipocytes (day 0) and differentiated 3T3-L1 adipocytes (day 8) served as negative and positive controls, respectively. Cellugyrin was used as a loading control. E: ATGL mRNA was measured in TSC2+/+ and TSC2−/− MEFs by quantitative PCR on the day of confluence. Gene expression was normalized to GAPDH mRNA levels, and data were presented as mean ± SD relative to ATGL expression in TSC2+/+ MEFs. F: TSC2+/+ and TSC2−/− MEFs were transiently transfected with −2979/+21 LUC ATGL promoter construct together with EGFP. After 48 h, cells were washed three times in cold PBS and harvested in the reporter lysis buffer. Luciferase activity in cell lysates was assayed as described in the research design and methods section and normalized by GFP fluorescence. Data are presented for triplicate samples as mean ± SD. G: TSC2+/+ and TSC2−/− MEFs were transfected with HA-tagged ATGL expression construct and allowed to grow for 3 days after confluence. Then, cells were replated onto 4-well chamber slides, fixed with 4% paraformaldehyde, permeabilized with 0.2% Triton X-100, and stained with primary anti-HA monoclonal antibody and cyanin 3–conjugated donkey anti-mouse IgG. Lipid droplets were stained with Nile red. The figure shows quantification of the number of fat droplets in 100 transfected (+ATGL) and nontransfected (−ATGL) cells. All panels: **P < 0.001. (A high-quality color representation of this figure is available in the online issue.)

