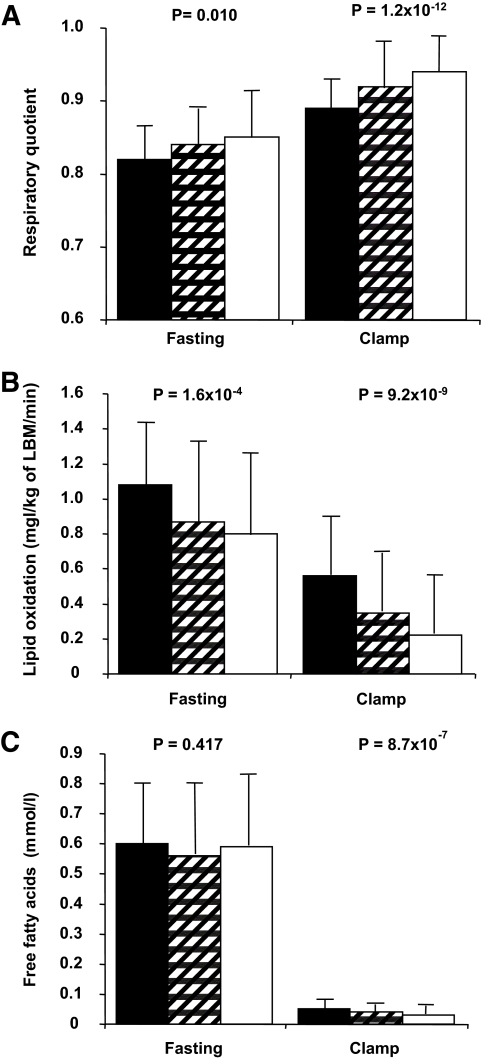
FIG. 2.
A: Respiratory quotient in the fasting state and during the hyperinsulinemic-euglycemic clamp in the tertiles of ΔEE. Data are means ± SD in the lowest (■), middle (▨), and highest (□) tertile. Lipid oxidation in the fasting state and during the hyperinsulinemic-euglycemic clamp in the tertiles of ΔEE (B) and FFAs in the fasting state and during the hyperinsulinemic-euglycemic clamp in the tertiles of ΔEE (C). Data are means ± SD.

