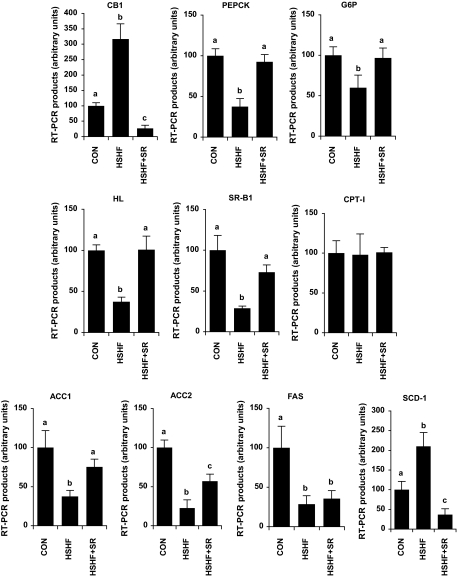
FIG. 3.
Effect of CB1 antagonism on the mRNA expression of CB1 and genes involved in carbohydrate and lipid metabolism in the liver. Mice were fed an HSHF diet for 25 weeks receiving during the last 6 weeks either 10 mg · kg−1 · day−1 of the CB1-specific antagonist SR141716 (HSHF+SR) or the vehicle (HSHF). In parallel, a series of mice was maintained on a control diet (CON). For each gene, a standard curve was established from four cDNA dilutions (1/10–1/10,000) and used to determine the relative gene expression after normalization with a geometric average of 18S and TATA box binding protein expression. Results are expressed as means ± SE (n = 5 per group). Values with different superscript letters (a, b, c) are statistically different at P < 0.05.

