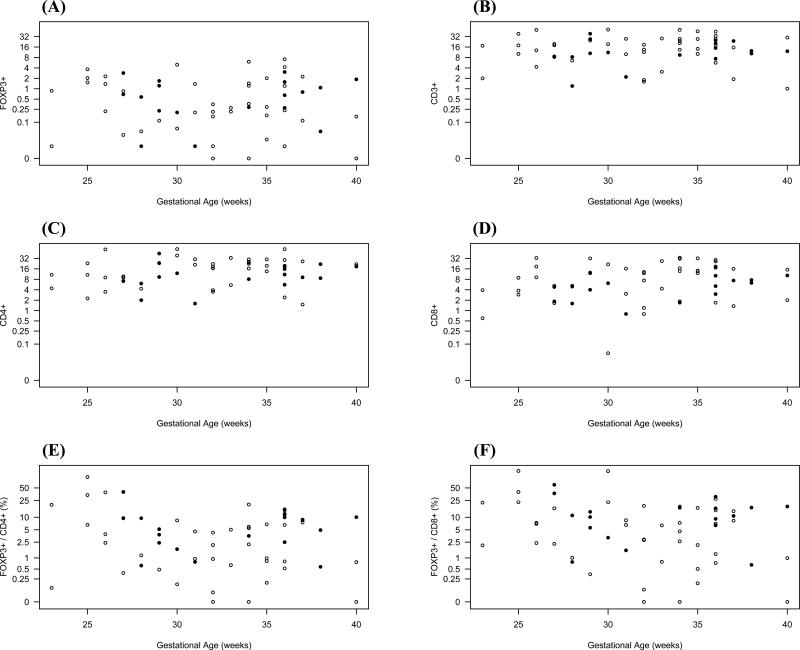
Figure 3.
Numbers of FOXP3+ (A), CD3+ (B), CD4+ (C), or CD8+ (D) cells per high-power field were plotted against increasing gestational age. Gestational age was calculated from the first day of the last menstrual period in weeks. Ratios of FOXP3+ cells to CD4+ cells and FOXP3+ to CD8+ cells are shown in (E) and (F), respectively. Samples from small intestine and large intestine are shown as in Figure 2.

