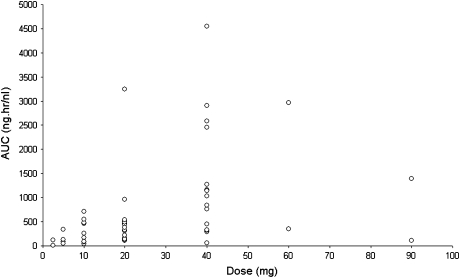
Figure 1.
Exposure [area under the curve (AUC)] versus AZD5438 dose. This figure shows the AUC as a function of AZD5438 dose. The AUCs were calculated after a single dose of AZD5438, on day 1 of treatment. There is a dose-proportional increase in exposure, but a high interpatient variability in exposure to AZD5438.

