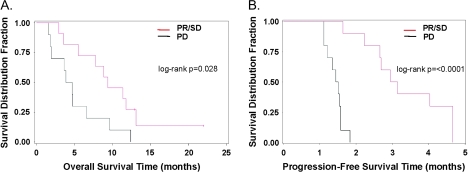
Figure 1.
Kaplan–Meier plots comparing patients with partial response (PR) and stable diseases (SD) versus progressive disease (PD). (A) Overall survival; median survival time 9.4 versus 4.3 months; log-rank test P = 0.028. (B) Progression-free survival; median survival time 3.0 versus 1.5 months; log-rank test P <0.0001. Red line: PR/SD; black line: PD.

