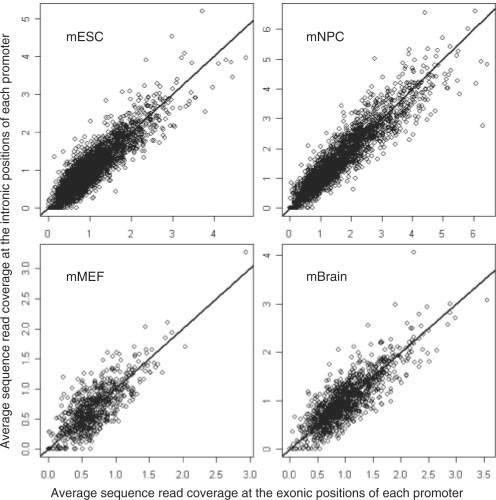
Fig. 3.
H3K27me3 signal at exonic positions versus H3k27me3 signal at intronic positions. For each promoter marked with H3K27me3 modification, we calculated the sequence read coverage for each exonic and intronic position. The sequence reads were based on the ChIP-seq data for H3K27me3 modification in the mouse ES cells, NP cells, MEF cells and brain tissue. Then the average read coverage for the exonic positions and the average read coverage for the intronic positions were calculated, respectively, for every promoter marked with H3K27me3 and shown in the figure. The straight line is y=x. The ‘full’ promoter set was used.

