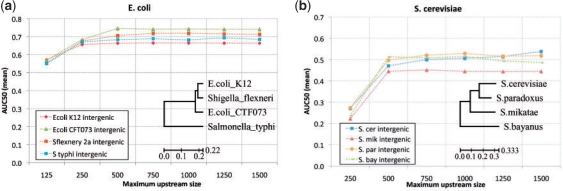
Fig. 1.
Single-species Gomo prediction accuracy using transferred GO maps. Each point shows the average AUC50 of TF–GO term associations predicted by Gomo using the E.coli (a) or S.cerevisiae (b) GO map and TFs, and promoter sequences from the single given species. The AUC50 is computed using a single TF, then averaged over TFs. The X-axis shows the maximum upstream extent of promoter sequences, which are truncated at the first ORF. The inset shows the phylogenetic tree of the corresponding species. Branch lengths denote average substitutions per site.

