Figure 1.
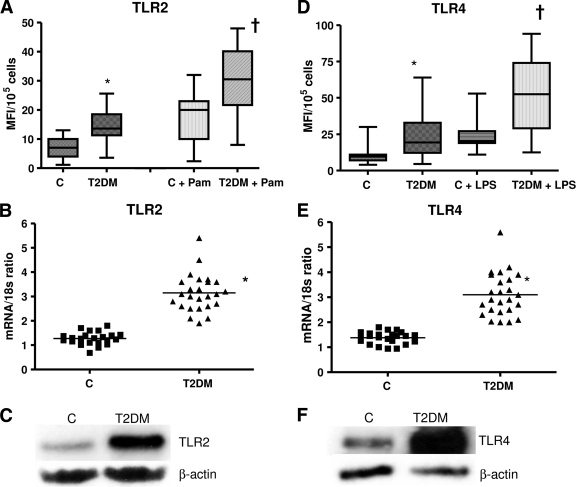
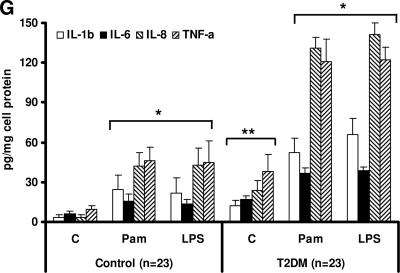
TLR protein and mRNA content. A: TLR2 surface protein expression was measured in monocytes after Pam3CSK4 (Pam) challenge in control (n = 23) and type 2 diabetic (n = 23) subjects by flow cytometry as described in research design and methods. Values are expressed as mean fluorescence intensity units (MFI)/105 cells. *P < 0.005 vs. control; †P < 0.05 versus C+Pam. C, control; T2DM, type 2 diabetes. B: Monocyte TLR2 mRNA expression ratios in control (n = 23) and type 2 diabetes (n = 23) subjects by real-time RT-PCR as described in research design and methods. 18s mRNA is used as the housekeeping gene. Values are expressed as mean ratio ± SD. *P < 0.001 vs. control. C: Representative Western blot depicting the TLR2 protein expression in pooled resting monocytes from three control subjects and three type 2 diabetic subjects. β-Actin was used as a loading control as described in research design and methods. Each assay is repeated four times. D: TLR4 surface protein expression was measured in monocytes after LPS challenge in control (n = 23) and type 2 diabetic (n = 23) subjects by flow cytometry as described in research design and methods. Values are expressed as mean fluorescence intensity units (MFI)/105 cells. *P < 0.005 vs. control; †P < 0.05 vs. C + LPS. E: Monocyte TLR4 mRNA expression ratios in control (n = 23) and type 2 diabetic (n = 23) subjects by real-time RT-PCR as described in research design and methods. 18s mRNA is used as the housekeeping gene. Values are expressed as mean ratio ± SD. *P < 0.005 vs. control. F: Representative Western blot depicting the TLR4 protein expression in pooled resting monocytes from three control and three type 2 diabetic subjects. β-Actin was used as a loading control as described in research design and methods. Each assay is repeated four times. G: Release of cytokines in resting and activated monocyte cell culture supernatants from control and type 2 diabetic subjects using Multiplex assay as described in research design and methods. Values are expressed as pg/mg cell protein. *P < 0.001 vs. untreated C; **P < 0.005 vs. control (healthy control). C, untreated; LPS, lipopolysaccharide, TLR4 ligand; Pam, Pam3CSK4, synthetic TLR2 ligand.


