Figure 2.
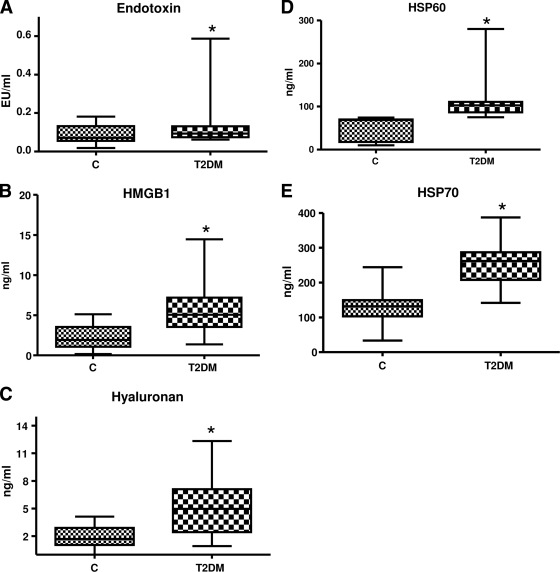
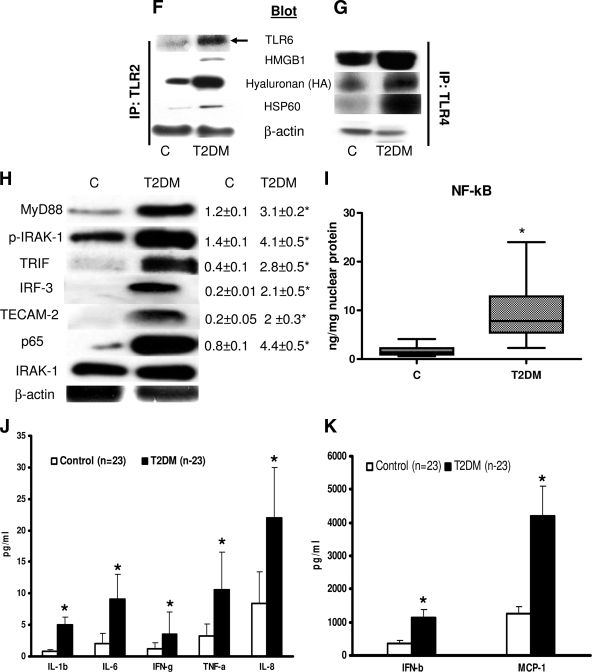
A: Endotoxin concentration in control (n = 23) and type 2 diabetic (n = 23) subjects was measured using Limulus Ameobocyte lysate assay as described in research design and methods. Values are expressed as EU/ml. *P < 0.05 vs. control. C, control; T2DM, type 2 diabetes. B: HMGB1 concentration in control (n = 23) and type 2 diabetic (n = 23) subjects was measured using ELISA as described in research design and methods. Values are expressed as ng/ml. *P < 0.0001 vs. control. C: Hyaluronan concentration in control (n = 23) and type 2 diabetic (n = 23) subjects was measured using ELISA as described in research design and methods. Values are expressed as ng/ml. *P < 0.0001 vs. control. D: HSP60 concentration in control (n = 23) and type 2 diabetes (n = 23) subjects was measured using ELISA as described in research design and methods. Values are expressed as ng/ml. *P < 0.0001 vs. control. E: HSP70 concentration in control (n = 23) and type 2 diabetic (n = 23) subjects was measured using ELISA as described in research design and methods. Values are expressed as ng/ml. *P < 0.0001 vs. control. F: Association of TLR2 with its ligands and TLR6. Representative Western blot showing enhanced expression of TLR6, HMGB1, hyaluronan, and HSP60 in basal control and type 2 diabetes monocyte cell lysates immunoprecipitated with TLR2 antibody as detailed in research design and methods. β-Actin was used as a loading control. Each assay is repeated four times. IP, immunoprecipitation. G: Association of TLR4 with its ligands. Representative Western blot showing enhanced expression of HMGB1, hyaluronan, and HSP60 in basal control and type 2 diabetes monocyte cell lysates immunoprecipitated with TLR4 antibody as detailed in research design and methods. β-Actin was used as a loading control. Each assay is repeated four times. H: Monocyte TLR signaling in the basal state. TLR downstream signaling proteins MyD88, pIRAK-1, Trif, IRF-3, TECAM-2, and NF-κB p65 were performed using specific antibodies to the respective (phospho) proteins, as described in research design and methods using β-actin as a loading and internal control for MyD88, Trif, IRF-3, TECAM-2, and NF-κB p65 and IRAK for pIRAK-1. Each blot is repeated four times with pooled monocytes from three subjects. Densitometric ratios corroborate the data. *P < 0.05 vs. control. I: The DNA binding activity of nuclear NF-κB p65 in control (n = 23) and type 2 diabetes (n = 23) monocytes was assessed by ELISA as detailed in research design and methods in the basal state. Values are normalized to milligram nuclear protein and expressed as mean ± SD. *P < 0.05 vs. control. J: Serum concentration of cytokines/chemokines in study subjects were measured using Multiplex assays as described in research design and methods. Values are expressed as picograms per milliliter. *P < 0.0001 vs. control. K: Serum concentration of cytokines/chemokines in study subjects were measured using Multiplex assays as described in research design and methods. Values are expressed as picograms per milliliter. *P < 0.0001 vs. control.


