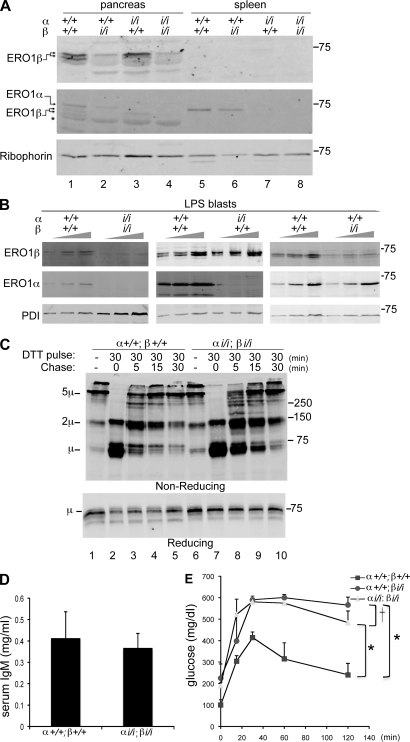
Figure 6.
Disulfide bond formation despite disruption of both ERO1-α and -β. (A) Immunoblot of ERO1-β (top), ERO1-α (middle), and Ribophorin I (bottom) in pancreatic and splenic membrane fractions of mice with the indicate ERO1-α and -β genotypes. Note that the levels of one ERO1 isoform do not change in response to decline in the other isoform. The asterisk marks a nonspecific band detected by the anti–ERO1-β serum in pancreas. (B) Immunoblots of ERO1 isoforms and PDI in lysates of LPS-induced B cell blasts of the indicated genotypes. To facilitate the comparison, three different loadings of each sample were analyzed. (C) Immunoblot of IgM from lysates of wild-type and compound mutant ERO1-αi/i; ERO1-βi/i LPS blasts after 30-min exposure to DTT in vivo and the indicated period of washout. The rate of recovery of disulfide bonds in IgM is reported on by the progressive depletion of monomers (1µ) and assembly of dimers (2µ) and pentamers (5µ) on this nonreducing gel. The sample in lane 1 is from cells that had never been exposed to DTT. A reducing gel with a fraction of the same samples is presented in the bottom panel. (A–C) Molecular mass is indicated in kilodaltons. (D) Serum IgM in 3-mo-old wild-type and compound mutant ERO1-αi/i; ERO1-βi/i mice. Shown are the mean and SEM (n = 3). (E) Blood glucose concentration after a glucose injection (as in Fig. 3 C) in mice with the indicated genotypes. Shown are the mean and SEM (n = 3; *, P < 0.001 by two way ANOVA; †, no significant difference).

