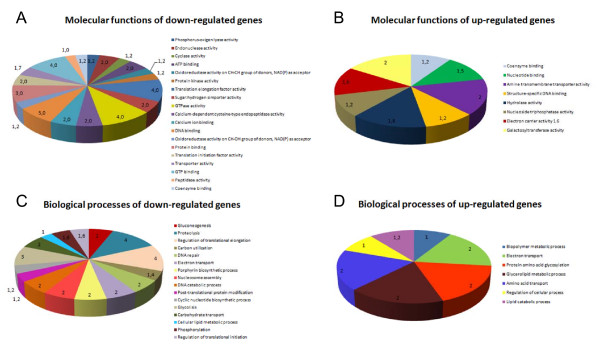
Figure 3.

Multilevel sector charts of α-scores for GO molecular functions annotated on differentially regulated genes under TPS. (A) Molecular function GO terms annotated on down-regulated genes under TPS. (B) Molecular function GO terms annotated on up-regulated genes under TPS. (C) Biological process GO terms annotated on down-regulated genes under TPS. (D). Biological process GO terms annotated on up-regulated genes under TPS.
