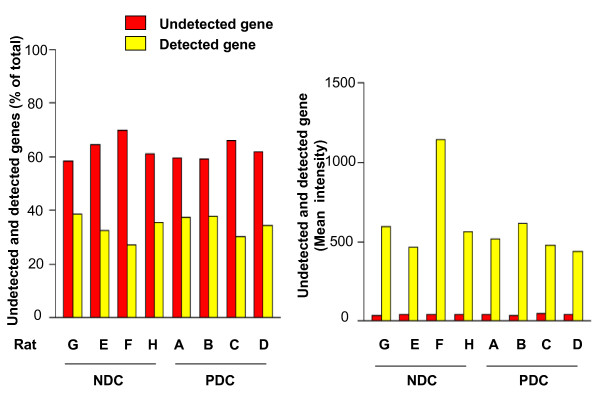
Figure 2.
Percentages (left panel) and mean gene expression intensities (right panel) of detected and undetected genes in 8 gene arrays. The number of undetected genes was higher than that of detected genes in all arrays (left panel). However, the mean gene expression intensities of detected genes were much higher than those of undetected genes in all arrays (right panel).

