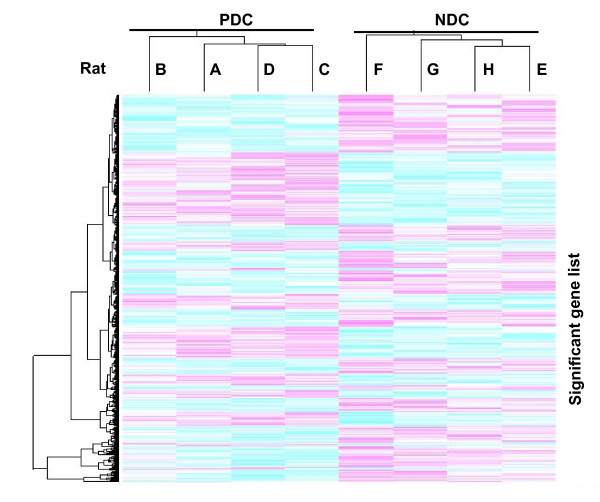
Figure 3.
Unsupervised hierarchical clustering analysis of 701 differentially expressed probe sets in all arrays. To identify the relationships between samples, a 1 - correlation metric with centroid linkage was applied to those probe sets. A dendrogram containing two distinct arms was identified. All four samples from poor oocyte developmental competence (PDC) group had similar gene expression patterns and were included in the same PDC cluster. On the other hand, all other four samples from normal oocyte developmental competence (NDC) group had similar gene expression patterns and were included in the same NDC cluster. The gene expression patterns were very different between PDC and NDC clusters.

