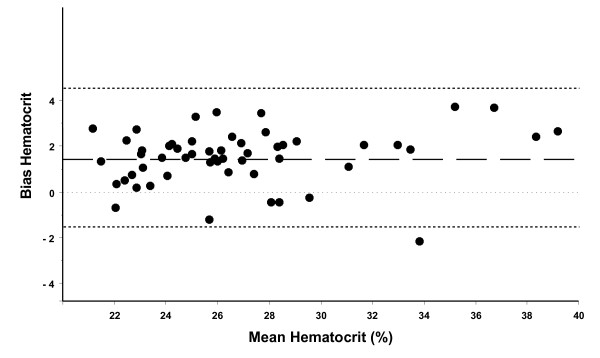
Figure 1.
Bland-Altman analysis for repeated measurements of all patients showed a good agreement with a bias of +1.39% and 2 standard deviations (2 SD) of ± 3.12%. The lower and upper limits of agreement (bias ± 2 SD) are -1.73 and 4.51%, respectively. Thus, the ABLflex 800 method showed elevated hematocrit by approximately 1.4%.

