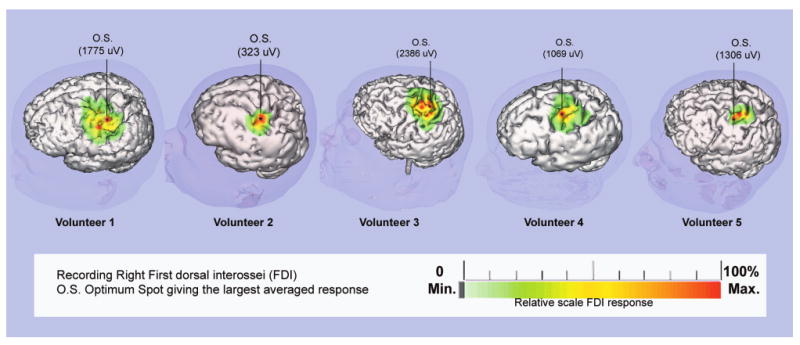
Fig. 3.

Motor area topographical maps for the right FDI muscle obtained from data using focal TMS with the coregistration system. The cortical surface area which when stimulated produced FDI CMAPs is color-coded as a function of CMAP amplitude. A single 4-point linear interpolation is used for assigning amplitude values between stimulated locations. The relative color scale below is normalized to the maximum CMAP amplitude acquired during the mapping session. The optimal FDI location was defined as the stimulated site leading to the maximum averaged CMAP amplitude.
