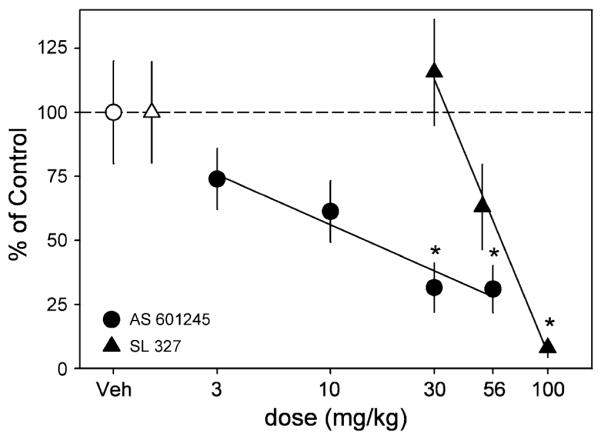
Fig. 3.

Modulation of 2% sucrose self-administration by MAPK inhibitors. Filled triangles represent the dose–effect curve for SL 327 and filled circles represent the dose–effect curve for AS 601245. Open symbols reflect the vehicle values for SL 327 (triangle) and AS 601245 (circle). Data are presented as a percent change from vehicle levels of means ± SEM (vertical lines) for number of reinforcements. Regression lines are shown that fit the effects of both ligands for this behavior. Asterisks denote significance as compared to vehicle (p<0.05)
