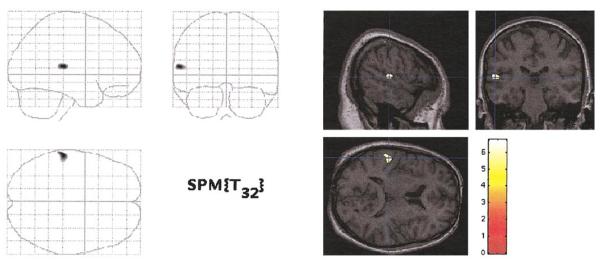
FIG. 1.
Left posterior superior temporal gyrus gray matter density reduction in first-episode schizophrenia subjects (n = 16) compared with healthy control subjects (n = 18). The SPM maps show statistically significant voxels that survived correction for multiple comparisons (initial threshold, P < 0.000001, t > 5.75; P < 0.05 when corrected for multiple comparisons). The left panel shows voxels mapped onto SPM coordinate space in a “transparent brain.” The right panel shows voxels mapped onto slices of a normalized brain of a control subject. (Neurological convention: the left part of the coronal image is subject left; the upper part of the axial image is subject left). The color scale shows t values for each significant voxel. Dark blue lines indicate the location of a section relative to other section planes.

