
FIG. 4.
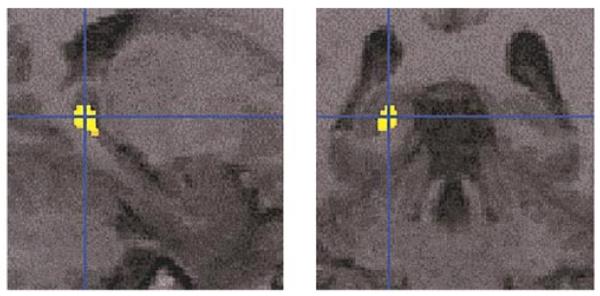
SPM analysis with 6-mm Gaussian smoothing kernel revealed statistically significant (after correcting for small volume) differences between the schizophrenia and control groups within the left posterior hippocampus (x, y, z): −18, −39, +1 (Z = 4.34).