Figure 3.

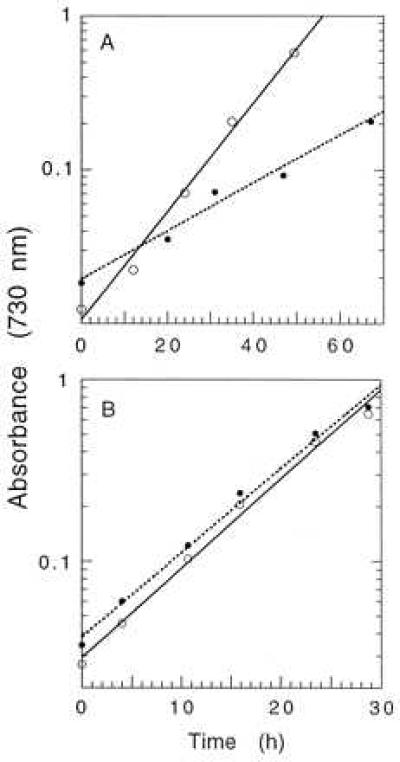
Growth curves of Synechocystis 6803 wild-type (○) and T363 (•) cells. (A) Cells grown in the absence of glucose in white light (100 μE per m2 per s). (B) Cells grown in the presence of glucose (5 mM) in white light (200 μE per m2 per s).

Growth curves of Synechocystis 6803 wild-type (○) and T363 (•) cells. (A) Cells grown in the absence of glucose in white light (100 μE per m2 per s). (B) Cells grown in the presence of glucose (5 mM) in white light (200 μE per m2 per s).