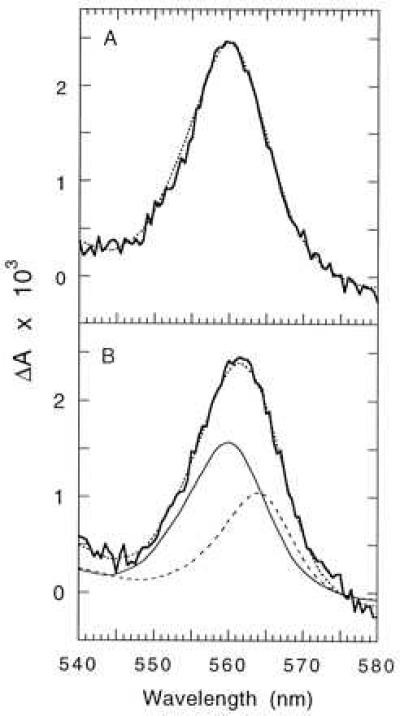
Figure 4.

Photoaccumulation of reduced cytochrome b559 in thylakoid membranes isolated from wild type (A) and cytochrome b559 and cytochrome b6 from the T363 fusion mutant (B). Synechocystis 6803 cells were grown in the light in the presence of glucose. Thylakoid membranes were suspended under anaerobic conditions in reaction medium (20 mM Mes, pH 6.0/20 mM CaCl2/20 mM MgCl2) at a chlorophyll concentration of 50 μM and illuminated for 30 s with white light at an intensity of 10,000 μE per m2 per s. Spectra were recorded before and immediately after illumination. (A) The bold line shows the photoreduction of cytochrome b559 in wild-type cells. The dotted line shows the spectrum of purified cytochrome b559. (B) The bold line shows the photoreduction of cytochrome b559 and cytochrome b6 in cells of strain T363. The dotted line shows the best fit of the sum of purified cytochrome b559 and cytochrome b6 (fitted by using Microsoft excel). The solid line shows the contribution of cytochrome b559 (60%) and the dashed line shows the contribution of cytochrome b6 (40%) giving the best fit.
