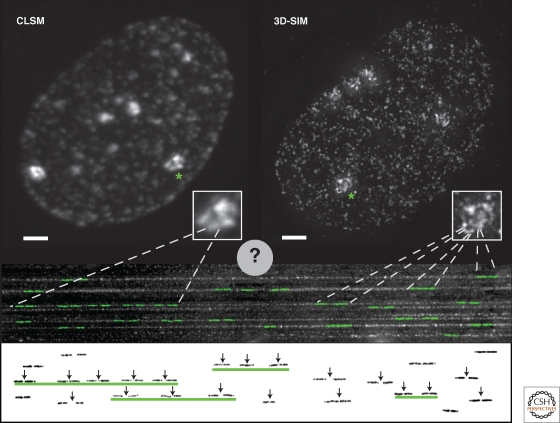
Figure 4.
Connecting replicon analysis on DNA fibers to whole cell in situ replication foci. Human HeLa cells expressing GFP-tagged PCNA were imaged using either conventional confocal laser scanning microscopy (CLSM) or super-resolution 3D-structured illumination microscopy (3D-SIM). Shown are maximal intensity projections of the full 3D image stacks illustrating the spatial organization of replication foci in late S phase. The inset shows a twofold magnification of the areas containing replicating heterochromatic regions marked by an asterisk in the image. Scale bar, 2 µm. Even in these condensed heterochromatin domains, the much larger number of individual replicating sites revealed by the increased resolution of the 3D-SIM technique is apparent. Below the cell images, combed DNA fibers are shown with a cartoon representation of nucleotide labeled replicon units overlayed in green. The same replicons are shown underneath with the vertical arrows indicating the origin of replication of each replicon. Several of the replicons are closed together in clusters (underlined by green lines), which initiate replication coordinately. By comparing labeling of replicons in combed DNA fibers and the numbers of replication foci counted by conventional light microscopy, it was concluded that one replication focus corresponds to a spatially organized cluster of replicons, as indicated by the dashed lines. Using 3D-SIM and other super-resolution nanoscopy techniques, much higher numbers of replication foci are resolved. This will soon allow us to measure in detail the characteristics of individual replicons that were formerly visualized only on stretched DNA fibers.

