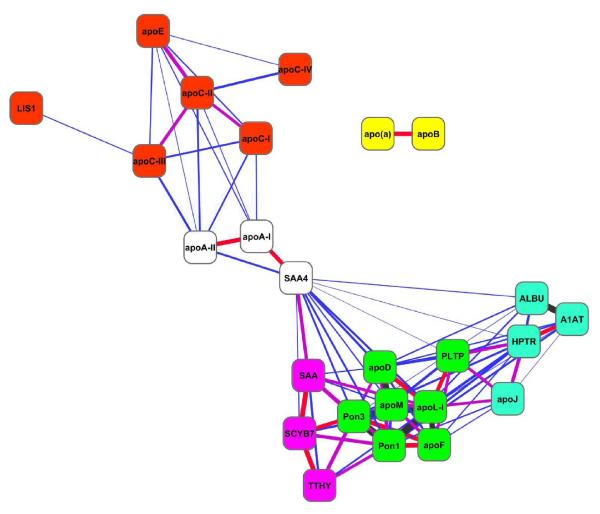
Figure 5. HDL proteins correlational network.
Each statistically significant correlation between HDL-associated proteins (nodes) is represented as a line (edge) between two proteins (nodes) with a thickness proportional to the Pearson coefficient (r) of the correlation (blue 0. 3<r< 0.5, purple 0.5<r<0.6, red 0.6<r<0.7 and black r>0.7). The nodes were treated like physical objects with mutually repulsive forces connected by metal springs representing the experimentally derived correlations; the sum of the forces emitted by the nodes and edges reaches a local minimum. The nodes were colored according to putative clusters determined visually. Lis1 refers to PAF-AH subunit 1B, A1AT; alpha-1-antitrypsin, HPTR; haptoglobin related protein, TTHY; transthyretin, SCYB7 (CXCL7); platelet binding protein precursor.

