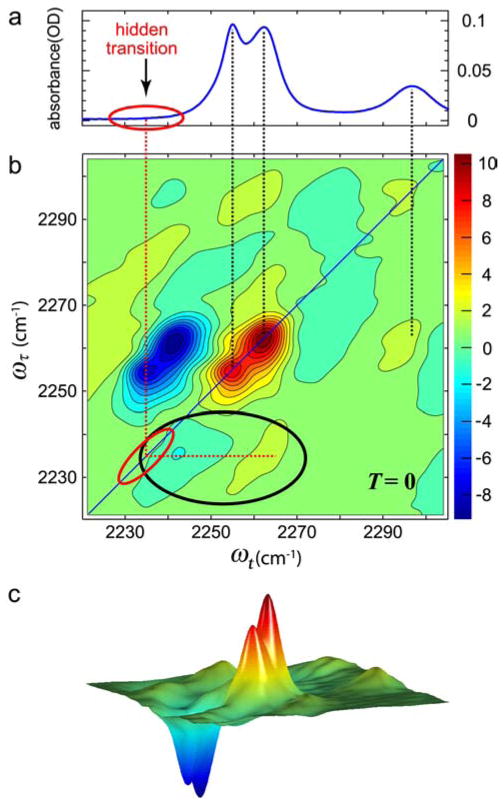
Figure 4.
Linear and 2D IR spectra of acetonitrile in methanol.158 (a) Linear FTIR spectra of CH3CN in MeOH at −17°C.158 (b) The real part of the absorptive 2D IR spectrum of CH3CN in MeOH at T =0. The band at 2297 cm−1 is a combination band of the CH bend and CC stretch of acetonitrile. The two black dotted lines connect the two transitions in linear to the v =0 →v =1 transitions in the 2D IR. The cross peaks involving hidden transitions are highlighted by the black ellipse. (c) A three-dimensional view of the 2D spectrum shown in (b).

