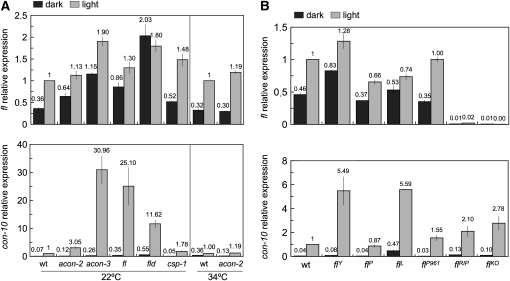
Figure 4.—
Photoactivation of the fl gene in the wild-type and developmental mutants. Mycelia of the wild-type and developmental mutants (A) or different fl strains (B) were exposed to white light (the active blue-light component was 1 W/m2 blue light) for 10 min or kept in the dark prior to RNA isolation. The amount of fl, con-10, and tub-2 RNAs was determined by quantitative RT–PCR. Each fluorescent signal was first normalized to the corresponding tub-2 signal to correct for loading errors and then was normalized to the signal obtained with the wild-type strain after exposure to light. The plot shows the average and standard error of the mean of the relative photoactivation in six experiments (A) or in two experiments (B). Each RNA sample was quantified in one PCR experiment. The fl strain in A was FGSC 4241.

