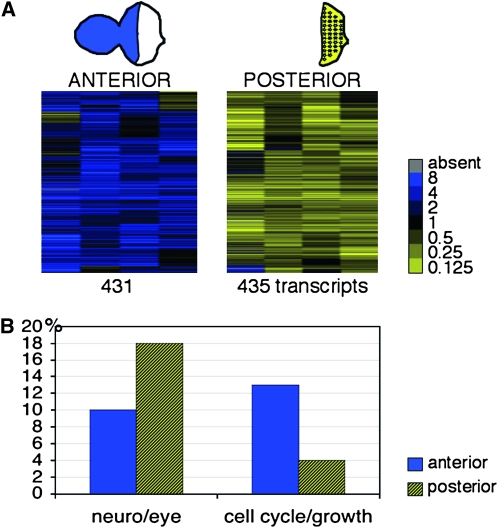
Figure 1.—
Microarray identification of transcripts enriched in the anterior or posterior region of the eye imaginal discs. (A) Cluster analysis of four replica experiments comparing microdissected posterior eye imaginal disc fragments to a common reference sample made from intact eye-antennal discs (columns). The two subclusters represent 431 transcripts (rows) with a predominant anterior (blue) and 435 transcripts with a posterior (yellow) expression that passed the significance of microarray analysis (SAM). The complete list of the 866 differentially expressed genes is available as Table S1. The legend provides the color-coded expression ratios. (B) Genes that are annotated to function in eye development and neuronal development are more abundant in the posterior group (hatched yellow; 18% posterior vs. 10% anterior), whereas genes that play a role in cellular growth and proliferation are overrepresented in the anterior group (blue; 13% anterior vs. 4% posterior). Genes were grouped on the basis of gene ontology terms (http://www.flybase.org, annotation release 5.16). A list is available as Table S2.

