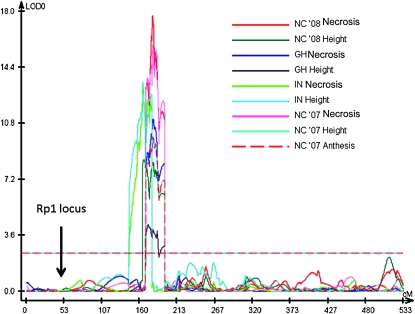
Figure 6.—
Chromosome 10 QTL likelihood plots for various Rp1-D21-associated traits in various environments: in a greenhouse in winter 2006 in Raleigh, North Carolina (denoted GH), in the field in West Lafayette, Indiana, in summer 2007 (IN), and in the field in Clayton, North Carolina, in summer 2007 and 2008 (NC '07 and NC '08). Three different traits were measured: lesion severity measured on a 1–5 scale (with 1 being complete absence of lesions and 5 being complete coverage of the ear leaf with lesions—denoted as Necrosis), the ratio between the average height of lesion mimic and wild-type individuals within each F1 family (Height), and the average divergence in time to anthesis in days between lesion mimic and wild-type individuals within each F1 family (Anthesis). Data were derived from a population derived from a cross between the Rp1-D21-H95 maize line heterozygous for Rp1-D21 and 233 different lines from the B73 × Mo17 advanced intercross IBM population. The y-axis shows the log of odds (LOD) likelihood ratio, and the x-axis denotes the position on the chromosome in IBM map units (Imu).

