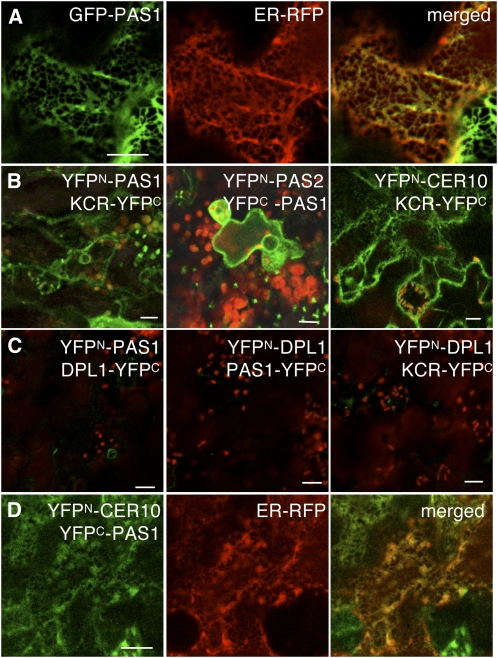
Figure 2.
PAS1 Interacts with Elongase Enzymes in the ER of Arabidopsis Epidermal Cells.
(A) Coexpression of 35S:GFP-PAS1 (left) and ER marker CD3-959:mCherry (middle) showed colocalization (merged, right).
(B) Coexpression of the split YFP pairs YFPN-PAS1/KCR-YFPC, YFPN-PAS2/ YFPC-PAS1, and YFPN-CER10/KCR-YFPC led to BiFC of YFP (green). Chloroplast autofluorescence is red.
(C) Coexpression of split YFP pairsYFPN-PAS1/ YFPC-DPL1, YFPN-DPL1/ YFPC-PAS1, and YFPN-CER10/YFPC-DPL1 did not produce any YFP fluorescence.
(D) Coexpression of YFPN-CER10/YFPC-PAS1 GFP (left) and ER marker CD3-959:mCherry (middle) showed BiFC colocalization in the ER (merged, right).
Bars = 10 μm in (A) to (C) and 40 μm in (D).

