Figure 3.
POLII Activity and H3K9 Dimethylation in the Ovule.
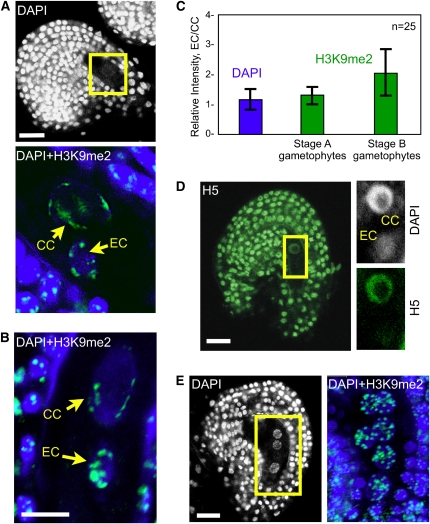
(A) Ovule following polar nuclei fusion. Top: DAPI staining of the whole ovule. Bottom: Close-up showing overlay of DAPI (blue) and H3K9me2 (green) and projection of consecutive optical sections. EC, egg cell; CC, central cell.
(B) Ovule at maturity prior to fertilization, overlay of DAPI (blue) and H3K9me2 (green), and projection of consecutive optical sections.
(C) Quantification of the relative H3K9me2 fluorescence intensity (green bars) between the egg cell and central cell (EC/CC) at two developmental stages (25 each) as shown in (A) and (B), respectively. The relative intensity is expressed as the ratio EC/CC of the mean intensity per pixel. Quantification of DAPI signals (blue bar) controls the accuracy of the measurements: despite differences between the egg and central cells in nuclear size, ploidy level and DNA compaction, the DAPI signal EC/CC ratio is equal to 1. The error bars represent sd.
(D) Mature ovule prior to fertilization stained with DAPI (white) and H5 (green) showing different levels of active POLII in the egg and central cell nuclei; projection of consecutive optical sections.
(E) Immature ovule prior to gametophyte cellularization showing comparable H3K9me2 distribution in all gametophytic nuclei; single optical section of the whole ovule stained with DAPI (left) reveals three gametophyte nuclei. Overlay of DAPI (blue) and H3K9me2 (green) signals (right) following projection of consecutive optical sections shows six out of the eight gametophytic nuclei.
Bars = 10 μm.

