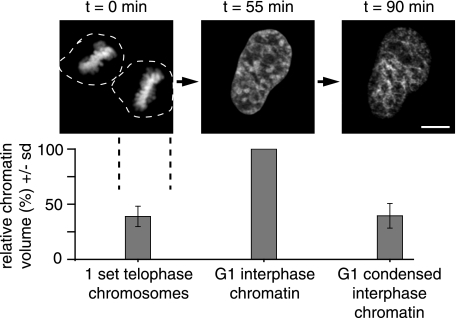
Figure 1.
Manipulation and quantification of chromatin condensation states. Individual HeLa cells expressing H2B-GFP as a marker for chromatin (23) were visualized starting in mitosis (left panel) into G1 (middle panel), and following incubation in hyperosmolar medium (right panel). At each time point, complete high-resolution confocal z stacks were acquired; projections are shown. Scale bar = 5 μm. Chromatin volume calculations were derived from complete z stacks. Bar diagram summarizes chromatin volume data as means ± sd (n=10 cells) relative to the value for G1 interphase chromatin in the same cell.

