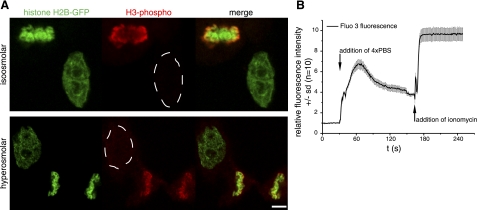
Figure 2.
Different pathways of chromatin condensation in mitosis and hyperosmolar condensation. A) Histone H3 is modified by phosphorylation at serine 10 during mitosis and was detected in formaldehyde-fixed HeLa H2B-GFP cells using anti-phospho H3S10-specific antibodies. Top panel: phosphorylated histone H3 signal (red) colocalizes with histone H2B-GFP-labeled chromosomes in the mitotic cell, but it is not detected in the interphase cell. Bottom panel: chromatin was condensed by hyperosmolar treatment to induce an interphase chromatin volume comparable to mitotic chromosomes (see Fig. 1). As in untreated cells, mitosis-specific histone H3 phosphorylation is not detectable in the interphase nucleus, and only in the mitotic chromosomes, suggesting a different pathway of mitotic and hyperosmolar chromatin condensation. B) Intranuclear calcium levels in HeLa cells (n=10), measured by time-lapse microscopy using the fluorescent calcium sensor Fluo 3. For untreated cells, initial Fluo 3 fluorescence intensity was normalized to 1 and, following incubation in hyperosmolar 4× PBS solution, increased 7-fold. To test for saturation effects and dynamic range of the Fluo 3 measurement conditions, the calcium ionophore ionomycin was added subsequently to the cells to induce maximum calcium uptake. This displays the whole range of fluorescence intensity measurable by the calcium sensor under the same imaging conditions and further suggests that the change in chromatin condensation after 4× PBS incubation involves a significant change in calcium level. Scale bar = 5 μm.

