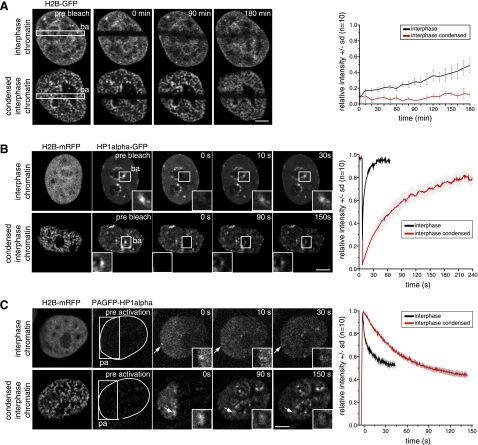
Figure 3.
Distribution and mobility of chromatin proteins in different chromatin condensation states. HeLa cells stably expressing H2B-GFP, as well as HeLa cells, transiently transfected with plasmids coding for H2B-mRFP and either GFP-HP1α or PAGFP-HP1α were used in photobleaching or photoactivation experiments of the respective chromatin proteins, as indicated. For all experiments, areas photobleached (ba) and photoactivated (pa) are indicated by squares; times after photobleaching/activation are given in the images. A) Photobleaching experiment shows histone H2B-GFP dynamics in interphase HeLa cells. Top row: untreated interphase chromatin. Bottom row: hyperosmolar condensed chromatin. B) Photobleaching experiments with HP1α-GFP for cells in interphase (top panel) and with hyperosmolar condensed interphase chromatin (bottom panel). Corresponding fluorescence recovery curves are at right; means ± sd (n=10 cells). C) Photoactivation experiments with HP1α fused to PAGFP. Dotted lines in images before fluorescence activation encircle nucleus and chromosomes, visualized independently with H2B-mRFP fusion. Graphs at right show dissociation of HP1α from chromatin, measured by loss of photoactivated fusion protein from interphase chromatin; means ± sd (n=10 cells). Insets: magnified view of accumulations of HP1α at heterochromatin (arrows; B, C). Scale bars = 5 μm.

