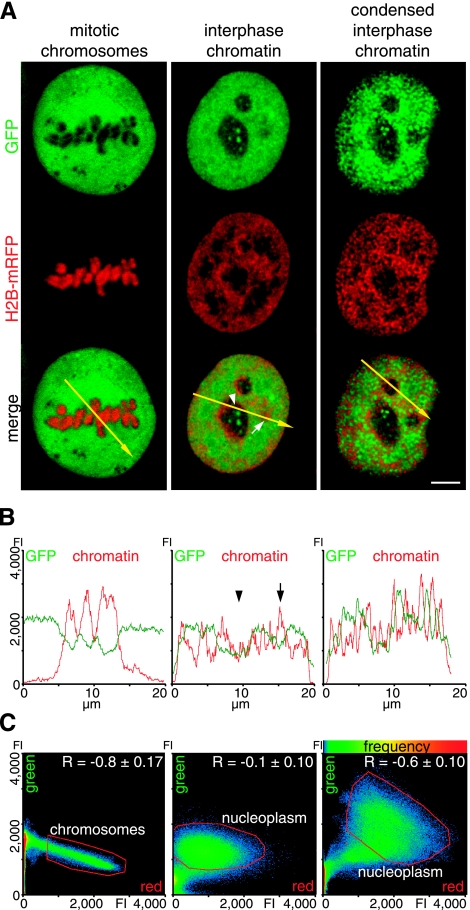
Figure 4.
Effect of chromatin condensation state on protein accessibility. A) Distribution of the inert tracer protein GFP, from the plasmid construct EGFP (Clontech), and histone H2B-mRFP-labeled chromatin in representative optical sections of cells in mitosis (left panel), in interphase (middle panel), and in the same interphase cells again after induced chromatin condensation (right panel). B) Line-scan analysis displays pixel intensity distribution of GFP (green) and chromatin (red), along the yellow arrow in the respective merged image in A. Regions with reduced protein concentration correspond to heterochromatin (arrow) and nucleoli (arrowhead). C) Scatterplots display pixel of merged image, according to intensity values of red and green channels; frequency of red-green pixel combination is coded by color (hot colors represent higher frequencies). Red line demarcates pixels corresponding to mitotic chromosomes, as well as to interphase nucleus, excluding nucleoli (referred to as nucleoplasm). Pearson correlation coefficient R is mean ± sd of 10 midsections in individual cells. Scale bar = 5 μm.

