Figure 5.
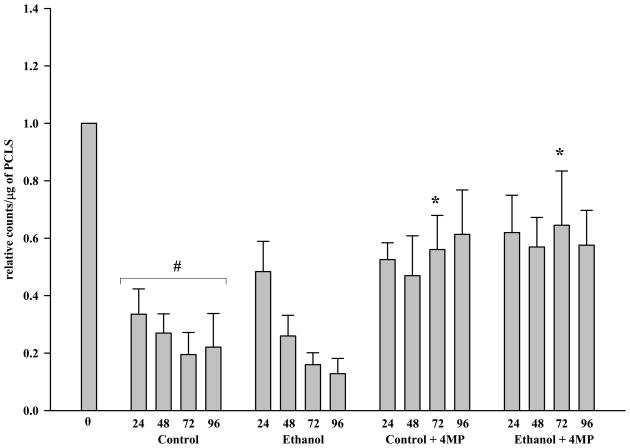
Figure 5A. CYP2E1 Expression in Microsomes from Rat Precision-Cut Liver Slices. PCLS were cultured at t0, 24, 48, 72 and 96 hours in the absence of ethanol (Control), absence of ethanol but the addition of 0.50 mM 4-MP (Control + 4-MP), presence of 25 mM ethanol (Ethanol), and in the presence of both 25 mM ethanol and 0.50 mM 4-MP (Ethanol + 4-MP). Microsomes were prepared as outlined in the Materials and Methods, loaded on SDS-PAGE gels (5 μg protein per lane), and analyzed by immunoblotting and densitometry as described in the Materials and Methods. The data are expressed as the mean ± S.E.M. of five separate experiments. Significantly decreased as compared to t0, #P < 0.001. Significantly increased as compared to the corresponding control PCLS, *P < 0.05.
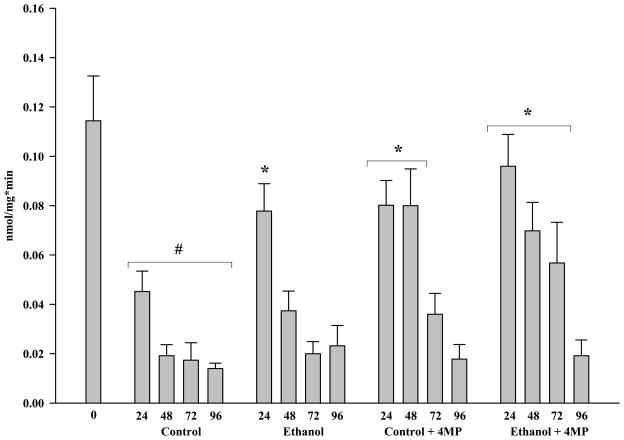
Figure 5B. CYP2E1 Activity in Microsomes from Rat Precision-Cut Liver Slices. PCLS were cultured at t0, 24, 48, 72 and 96 hours in the absence of ethanol (Control), absence of ethanol but the addition of 0.50 mM 4-MP (Control + 4-MP), presence of 25 mM ethanol (Ethanol), and in the presence of both 25 mM ethanol and 0.50 mM 4-MP (Ethanol + 4-MP). Microsomes were assayed for the presence of CYP2E1 using p-Nitrophenol oxidation as described in the Materials and Methods. The data are expressed as the mean ± S.E.M. of five separate experiments. Significantly decreased as compared to t0, #P < 0.001. Significantly increased as compared to the corresponding control PCLS, *P < 0.05.


